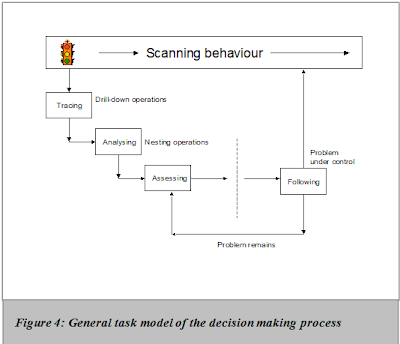
The succession of steps that managers perform when they are engaged in the intelligence phase (see Turban, 1993) using a business intelligence system, can be generalized as a set of strategies that make up a general task model of the senior manager when involved in a decision making process. This general task model of the decision making process accommodates the procedure discovered by Borgman. That procedure shows that managers are engaged initially in broad and systematic browsing (the checklist scanning approach) and focus, in a later stage, based on the results of the scan with large conceptual distances between successive queries (Borgman, 1994). This checklist scanning approach can be extended and translated into the following successive steps.
10 steps for scanning and solving problems
1. Scanning;
2. When during the scanning process information is perceived as a problem, tracing of the problem can take place or the perceived problem can be placed on the checklist;
3. After tracing (drill-down operations) the problem can be analyzed (by applying nesting operations or other useful functions during this process). See § 5.3.2 for a brief description of the terms drill-down and nesting;
4. During the tracing and analysis process, causal cards should be available to display relations between variables;
5. It is also important during this analysis process that the time perspective is prominently available since it is important when the problem started to appear;
6. After analysis, the problem can be documented, assessed and communicated to others;
7. Here ends the first phase of the decision making process and the view that represents the problem should be automatically placed at a more prominent place on the screen;
8. As long as the problem is not solved it should remain on the screen;
9. The problem shall be placed less prominently when the implementation of the decision starts working. If the planning figures or norms are available, the system can decide to delete the view when the problem meets the expectations underlying the planning or norm. Another statement can decide to delete the view or put it into the problem history box, as it is no longer analyzed by the manager.
10. Here the cycle begins from scratch.
Specific analytical operations
The variation in the above cycle is that every step might have its own specific analytical operations. For example, the scanning process needs no drill down operation until a problem is perceived. During the scanning phase, it is important that deviations are perceived quickly and that as much information as possible can be viewed immediately. It would be preferable to enable operations such as scrolling and displaying the information in various forms (such as switching between graphs and tables). Even the type of the graph can depend on the steps in above general process. Correlation graphs are very useful in the analysis phase and line graphs with show trends compared to norms can be made available in the scanning phase to signal that there is a problem. Important with all types of presentations and especially graphs is that it is crucial which message the graph should transmit to the user (Zelazny, 1996).
Different modes
The above steps are, in fact, different modes of the business intelligence system during the decision making process. It consists of a scanning-mode, a trace-mode and so on. Employing a system with different modes should be avoided because switching between them needs human processing. Often the user forgets which mode the system is in and identical functions that behave differently can cause errors and can even damage the object(s) of interest (Donald Norman, 1988; Mandel, 1997).
How to avoid switching?
To avoid switching modes manually we should employ a tracking system that is able to determine (based on the state of the data and previous navigation operations) which functions, belonging to the different steps, should be enabled. The mapping between the mode of the decision making process and the operations applicable and presentations available should be flexible. The user should always stay in control (Mandel, 1997). Therefore, menu items that are not considered as useful in one mode should not be made invisible or disabled (this will harness the user), but should be less easy to access.
No comments:
Post a Comment